
Page 53 - PIECES OF THE PUZZLE Eline Vissia
P. 53
HIPPOCAMPAL MORPOHLOGY AND CHILDHOOD TRAUMA
115
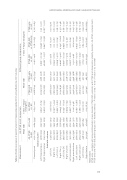
Table 3.2 Statistical analyses of parenchymal (cm3), hippocampal global (mm3) and subfields (0.5 mm3) volumes
Measurement
All-PTSD to HC comparison
Different group comparisons
t-test: P Value (change%)
Parenchymal
1072 (779)
1084 (599)
0.69 (-1.11) 0.012* (-6.75)
1068 (819)
1075 (759)
0.48 (-1.48) 0.001* (-10.19)
0.78 (-0.65) 0.046* (-7.25)
0.70 (-0.83)
Global volume
Left hippocampus 2086 (229) Right hippocampus 2145 (204)
2237 (196) 2340 (205)
0.001* (-8.33) 0.56 (0.62)
2009 (208) 2074 (185)
2166 (228) 2220 (202)
<0.001* (-11.37) 0.78 (-2.28)
0.047* (-6.58) 0.16 (-5.77)
0.30 (-3.17) 0.067^ (-5.13)
Left CA1 Right CA1
Left CA2-3 Right CA2-3 Left CA4-DG Right CA4-DG Left presubiculum Right presubiculum Left subiculum Right subiculum Left fimbria Right fimbria
2436 (321) 2425 (300) 6789 (857) 7303 (930) 3836 (506) 4032 (464) 3521 (361) 3413 (350) 4680 (561) 4694 (435) 498 (104) 503 (90)
2421 (304) 2551 (265) 7284 (832) 7778 (851) 4094 (462) 4361 (468) 3721 (364) 3591 (377) 4919 (439) 4905 (442) 498 (164) 471(158)
0.090^ (-4.94) 0.031* (-6.80) 0.043* (-6.11) 0.053^ (-6.30) 0.009* (-7.54) 0.027* (-5.37) 0.12 (-4.96) 0.082^ (-4.86) 0.085^ (-4.30) 0.90 (0.00) 0.25 (6.79)
2366 (330) 2382 (258) 6578 (995) 7074 (838) 3680 (580) 3942 (455) 3413 (361) 3430 (344) 4476 (567) 4613 (412) 491 (115) 521 (92)
2511 (302) 2471 (341) 7012 (640) 7547 (986) 4003 (361) 4128 (470) 3635 (336) 3396 (368) 4896 (482) 4780 (455) 507 (95) 485 (87)
0.024* (-6.62) 0.009* (-9.70) 0.006* (-9.06) 0.007* (-10.12) 0.003* (-9.61) 0.007* (-8.28) 0.30 (-4.48) 0.007* (-9.00) 0.020* (-5.95) 0.83 (-1.58) 0.11 (10.59)
0.12 (-3.61)
0.20 (3.70) 0.60 (-3.12) 0.38 (-3.73) 0.57 (-2.98) 0.66 (-2.22) 0.19 (-5.34) 0.35 (-2.32) 0.13 (-5.43) 0.89 (-0.46) 0.63 (-2.54) 0.99 (1.67) 0.80 (2.89)
Abbreviations:
Subfield volumes
All-PTSD (n=33)
HC (n=28)
All-PTSD vs. HC
PTSD-DID (n=17)
PTSD-only (n=16)
PTSD-DID vs. HC
PTSD-DID vs. PTSD-only
PTSD-only vs. HC
Mean (SD)
t-test: P Value (change%)
Mean (SD)
PTSD-only = patients with only posttraumatic stress disorder; PTSD-DID= patients with PTSD and PTSD-only and PTSD-DID patient groups. HC= healthy controls; * P-value ≤ 0.05; ^ 0.05 < P-value
dissociative identity disorder; All-PTSD= includes both ≤ 0.1 (a trend)
0.12 (-6.19) 0.052^ (-6.26) 0.046* (-8.07) 0.13 (-4.50) 0.11 (-6.09) 0.64 (1.00) 0.022* (-8.57) 0.10^ (-3.49) 0.85 (-3.20) 0.24 (7.48)
