
Page 61 - Cardiac abnormalities after aneurysmal subarachnoid hemorrhage
P. 61
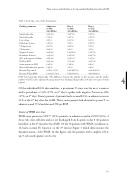
Time course and risk factors for myocardial dysfunction after aSAH Table 2: shows the course of the determinants.
Cardiac parameters
Admission n=301* (298 ECGs)
Day 4 n=283* (264 ECGs)
Day 8 n=272* (224 ECGs)
Sinusbradycardia Sinustachycardia
Low voltage
Pathologic Q wave ST-depression ST-elevation
Negative T-waves Prominent U-waves
QTc prolongation >500ms LVH on ECG
Strain pattern on ECG Myocardial infarction pattern Elevated Troponin T Elevated NT-proBNP
41(14%) 39(15%) 19(6%) 13(5%) 8(3%) 16(6%) 14(5%) 7(3%) 26(9%) 10(4%) 10(3%) 3(1%) 90(30%) 134(51%) 99(33%) 85(32%) 43(14%) 29(11%) 56(19%) 37(14%) 14(5%) 11(4%) 13(4%) 5(2%) 97/261 (37%) 65/244(27%) 159/225 (71%) 85/207(41%)
18(8%) 21(9%) 6(3%) 10(5%) 5(2%)
3(1%) 61(27%) 60(27%) 11(5%) 39(17%) 8(4%)
9(4%) 29/190(15%) 49/150(33%)
LVH: Left ventricular hypertrophy. *The difference between the number of alive patients and the smaller 4 number of ECGs can be explained because patients were discharged (largest effect at 8 days) or because of study
logistics.
Of the individual ECG abnormalities, a prominent U-wave was the most common with a prevalence of 33% (27% on 8th day) together with negative T-waves in 30% (27% on 8th day). Twenty percent of patients had a normal ECG on admission versus 31% at the 8th day after the aSAH. Thirty seven percent had elevated troponin T on admission and 71% had elevated NT-proBNP.
Course of WMA over time:
WMA were present in 58/277 (21%) patients on admission and in 29/187(16%) of those who were still alive and not yet discharged from hospital on day 8 (26 patients had died on the 8th day after the aSAH). Of the 58 patients with WMA on admission, 14 had a normal LV function on the 8th day(see Figure 1 which demonstrates the dynamic nature of the WMA. In this figure only the patients with complete follow up (3 echocardiograms) are shown).
59
