
Page 121 - The diagnostic work-up of women with postmenopausal bleeding
P. 121
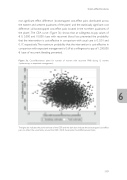
non-significant effect difference (bootstrapped cost-effect pairs distributed across the eastern and western quadrants of the plane) and the statistically significant cost difference (all bootstrapped cost-effect pairs located in the northern quadrants of the plane).The CEA curve (Figure 3b) shows that at willingness-to-pay values of € 0, 5,000 and 10,000 /case with recurrent blood loss prevented the probability that the intervention is cost-effective in comparison with usual care is 0, 0.01 and 0.17, respectively.The maximum probability that the intervention is cost-effective in comparison with expectant management is 0.69 at a willingness-to-pay of 1,200,000 € /case of recurrent bleeding prevented.
Figure 3a. Cost-effectiveness plane for number of women with recurrent PMB during 12 months (hysteroscopy vs expectant management)
6
Cost-effectiveness
The light dot indicates the point estimate of the ICER and the dark dots indicate the bootstrapped cost-effect pairs to reflect the uncertainty around the ICER (ICER, Incremental Cost-Effectiveness Ratio).
119
