
Page 123 - The diagnostic work-up of women with postmenopausal bleeding
P. 123
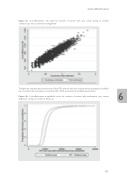
Figure 4a. Cost-effectiveness (CE) plane for number of women with (pre) cancer during 12 months (hysteroscopy versus expectant management)
The light dot indicates the point estimate of the ICER and the dark dots indicate the bootstrapped cost-effect
pairs to reflect the uncertainty around the ICER (ICER, Incremental Cost-Effectiveness Ratio). 6
Figure 4b. Cost-effectiveness acceptability curve for number of women with endometrial (pre) cancer diagnosed during 12 months of follow-up
Cost-effectiveness
121
