
Page 120 - The diagnostic work-up of women with postmenopausal bleeding
P. 120
Chapter 6
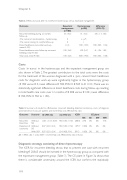
Table 2. Effects and costs after 12 months for hysteroscopy versus expectant management
Outcome
Expectant management (n=100)
Hysteroscopy (n=98)
difference (95% CI)
Recurrent bleeding during 12 months follow-up
(Pre) cancer at randomization - hysteroscopy (Pre) cancer during 12 months follow-up
Direct healthcare costs, initial work-up, mean € (SD)
Direct healthcare costs, follow-up recurrent bleeding, mean € (SD)
Total costs, mean € (SD)
Costs
18 (18.0)
0
0 0 (0)
108 (365) 108 (365)
15 (15.3)
6 (6.9)
1
788 (1333)
100 (567) 888 (1435)
-3% (-13 - 8%)
-
-
788 (585 - 1132)
-8 (-106 - 185) 780 (550 - 1158)
Costs (in euros) in the hysteroscopy and the expectant management group are also shown inTable 2.The greatest contributors to the total costs were the costs for the treatment of the women diagnosed with a (pre) cancer. Direct healthcare costs for diagnostic work-up were significantly higher in the hysteroscopy group (€ 788 versus € 0, mean difference € 788, 95% CI € 585 to € 1132).There was no statistically significant difference in direct healthcare costs during follow-up, resulting in total health care costs over 12 months of € 888 versus € 108 (mean difference € 780, 95% CI 550 to 1158).
Table 3. Summary of results for effectiveness (recurrent bleeding, detection carcinoma), costs (of diagnosis and treatment, in euros per patient) and incremental cost-effectiveness ratio
Recurrent Without -0.03 (-0.13 ; 0.08) 780 (550 ; 1158) 28865 69% 0% 0% 31%
Outcome
Scenario
ΔE (95% CI)
ΔC (95% CI)
ICER
CE plane
NE
SE
SW
NW
blood loss SIS
0.07 (0.03 ; 0.14) 0.07 (0.03 ; 0.14)
780 (550 ; 1158) 634 (408 ; 996)
10917 100% 0% 8913 100% 0%
0% 0% 0% 0%
Detection of carcinoma SIS
Without
With SIS*
ΔE = effect ; ΔC = costs; ICER = incremental cost-effectiveness ratio in Euros
Diagnostic strategy consisting of direct hysteroscopy
The ICER for recurrent bleeding shows that to prevent one case with recurrent bleeding € 28,865 should be invested in the hysteroscopy group as compared with the expectant management group (Table 3).The CE plane in Figure 3a shows that there is considerable uncertainty around the ICER, but confirms the statistically
118
