
Page 52 - ADD-ON ABLATION SURGERY IN PATIENTS WITH ATRIAL FIBRILLATION
P. 52
Chapter 2
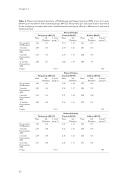
Table 4. Means and standard deviations of Multidimensional Fatigue Inventory (MFI) scores for 1-year follow-up in total and for both treatment groups (N=132). First p-value per scale tests linear 1-year trend for the total group, second p-value tests overall interaction time*group effect (i.e. difference in 1-year trend between groups).
General Fatigue
Total group (N=132)
Control (N=67)
Add-on (N=65)
Mean
Std. Deviation
P- time* group *)
Mean
Std. Deviation
Mean
Std. Deviation
P-linear* group ^)
Pre-operative (M1/Baseline)
3 months Postoperative (M2)
6 months Postoperative (M3)
12 months Postoperative (M4)
P-value
Pre-operative (M1/Baseline)
3 months Postoperative (M2)
6 months Postoperative (M3)
12 months Postoperative (M4)
P-value
Pre-operative (M1/Baseline)
3 months Postoperative (M2)
6 months Postoperative (M3)
12 months Postoperative (M4)
P-value
3.56 2.87
2.67 2.85
3.45 2.89
2.69 2.85
3.32 2.90
2.64 2.71
1.11 1.13
1.13 1.01
1.10 1.16
1.16 1.04
1.15 1.08
1.18 1.08
<.001
3.51 2.93
2.76 2.82
3.33 2.96
2.79 2.96
3.31 3.02
2.72 2.72
1.12 1.20
1.19 1.03
1.04 1.17
1.24 1.06
1.13 1.06
1.23 1.11
3.62 2.81
2.58 2.88
3.57 2.82
2.58 2.74
3.33 2.78
2.55 2.71
1.10 1.06
1.07 .99
1.16 1.15
1.08 1.01
1.19 1.09
1.13 1.05
.410
Physical Fatigue
Total group (N=132)
Control (N=67)
Add-on (N=65)
Mean
Std. Deviation
P- time* group *)
Mean
Std. Deviation
Mean
Std. Deviation
P-linear* group ^)
<.001
.299
Reduced Activity
Total group (N=132)
Control (N=67)
Add-on (N=65)
Mean
Std. Deviation
P- time* group *)
Mean
Std. Deviation
Mean
Std. Deviation
P-linear* group ^)
<.001
.430
60
