
Page 50 - ADD-ON ABLATION SURGERY IN PATIENTS WITH ATRIAL FIBRILLATION
P. 50
Chapter 2
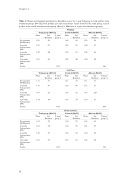
Table 3. Means and standard deviations for EuroQoL scores for 1-year follow-up in total and for both treatment groups (N=132). First p-value per scale tests linear 1-year trend for the total group, second p-value tests overall interaction time*group effect (i.e. difference in 1-year trend between groups).
Mobility
Total group (N=132)
Control (N=67)
Add-on (N=65)
Mean
Std. Deviation
P- time* group *)
Mean
Std. Deviation
Mean
Std. Deviation
P-linear* group ^)
Pre-operative (M1/Baseline)
3 months Postoperative (M2)
6 months Postoperative (M3)
12 months Postoperative (M4)
P-value
Pre-operative (M1/Baseline)
3 months Postoperative (M2)
6 months Postoperative (M3)
12 months Postoperative (M4)
P-value
Pre-operative (M1/Baseline)
3 months Postoperative (M2)
6 months Postoperative (M3)
12 months Postoperative (M4)
P-value
1.50 1.50
1.47 1.50
1.11 1.16
1.09 1.14
1.63 1.53
1.49 1.52
.50 .51
.48 .46
.31 .41
.26 .34
.59 .68
.59 .57
<.001
1.49 1.56
1.52 1.55
1.11 1.20
1.09 1.15
1.64 1.65
1.62 1.59
.49 .50
.50 .48
.31 .49
.26 .37
.59 .75
.67 .59
1.52 1.44
1.42 1.44
1.11 1.12
1.09 1.14
1.62 1.41
1.34 1.46
.50 .51
.46 .45
.31 .31
.267 .31
.60 .59
.47 .54
.346
Self Care
Total group (N=132)
Control (N=67)
Add-on (N=65)
Mean
Std. Deviation
P- time* group *)
Mean
Std. Deviation
Mean
Std. Deviation
P-linear* group ^)
<.001
.460
Usual activities
Total group (N=132)
Control (N=67)
Add-on (N=65)
Mean
Std. Deviation
P- time* group *)
Mean
Std. Deviation
Mean
Std. Deviation
P-linear* group ^)
<.001
.056
58
