
Page 51 - ADD-ON ABLATION SURGERY IN PATIENTS WITH ATRIAL FIBRILLATION
P. 51
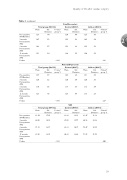
Table 3. continued
Pre-operative (M1/Baseline)
3 months Postoperative (M2)
6 months Postoperative (M3)
12 months Postoperative (M4)
P-value
Pre-operative (M1/Baseline)
3 months Postoperative (M2)
6 months Postoperative (M3)
12 months Postoperative (M4)
P-value
Pre-operative (M1/Baseline)
3 months Postoperative (M2)
6 months Postoperative (M3)
12 months Postoperative (M4)
P-value
1.26 1.47
1.46 1.51
1.37 1.28
1.18 1.20
61.54 68.42
71.51 69.81
.44 .52
.57 .54
.59 .52
.35 .40
17.62 14.90
16.71 16.09
1.28 1.53
1.59 1.64
1.43 1.28
1.19 1.27
61.60 67.89
69.61 68.60
.44 .50
.60 .52
.65 .54
.37 .47
16.13 15.77
18.17 16.64
1.25 1.42
1.33 1.38
1.31 1.28
1.16 1.13
61.47 68.96
73.47 71.05
.43 .54
.50 .53
.53 .50
.34 .29
19.16 14.06
14.95 15.52
2
Quality of life after cardiac surgery
Pain/Discomfort
Total group (N=132)
Control (N=67)
Add-on (N=65)
Mean
Std. Deviation
P- time* group *)
Mean
Std. Deviation
Mean
Std. Deviation
P-linear* group ^)
<.001
.006
Anxiety/Depression
Total group (N=132)
Control (N=67)
Add-on (N=65)
Mean
Std. Deviation
P- time* group *)
Mean
Std. Deviation
Mean
Std. Deviation
P-linear* group ^)
<.001
.267
VAS
Total group (N=132)
Control (N=67)
Add-on (N=65)
Mean
Std. Deviation
P- time* group *)
Mean
Std. Deviation
Mean
Std. Deviation
P-linear* group ^)
<.001
.488
59
