
Page 49 - Cardiac abnormalities after aneurysmal subarachnoid hemorrhage
P. 49
Cardiac dysfunction after aneurysmal subarachnoid hemorrhage: relationship with outcome
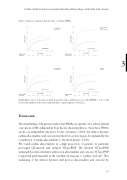
Figure 1: Fraction of death in patients with- or without WMAs. 0,4
0,4
0,3
0,2
0,1
0,0
0,4
0,3
0,2
0,1
0,0
No midventricular WMA Midventricular WMA
No Basal WMA Basal WMA
0,3
0,2
0,1
0,0
0,4
0,3
0,2
0,1
0,0
Log-rank p=0.51
Log-rank p=0.0002
Number at risk
Basal WMA
Time in days
Number at risk
Midventr. WMA
0
279
20
220
40
60
80 90 100
0 20
279 211
40 60
Time in days
202 200
80 90 100
211
208
205
204
197
193
No apical WMA Apical WMA
WMSI=1 WMSI>1
3
Log-rank p=0.12
Log-rank p=0.02
Number at risk
Apical WMA
Time in days
199 197
Number at risk
WMSI>1
0
273
20
208
40
60
80 90 100
194 193
0 20
279 211
40 60 80 90 100
Time in days
202 200 197 193
Kaplan-Meier curves of fraction of death in patients with a wall motion score index(WMSI) > 1.0 or wall motion abnormalities in the basal, midventricular or apical segments of the heart.
Discussion
The main finding of the present study is that WMAs are a predictor for adverse clinical outcome in aSAH, independent from known clinical predictors. Since these WMAs are also an independent risk factor for the occurrence of DCI, the relation between cardiac abnormalities and outcome may therefore, at least in part, be explained by the contribution of cardiac abnormalities to the development of DCI.
We found cardiac abnormalities in a high proportion of patients; in particular prolonged QT-interval and elevated NT-proBNP. The elevated NT-proBNP, weakened the relation between wall motion abnormalities and outcome. NT-proBNP is expressed predominantly in the ventricles in response to cardiac overload.15 This weakening of the relation between wall motion abnormalities and outcome by
47
Fracon of death Fracon of death
Fracon of death Fracon of death
