
Page 47 - Cardiac abnormalities after aneurysmal subarachnoid hemorrhage
P. 47
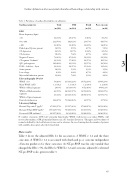
Cardiac dysfunction after aneurysmal subarachnoid hemorrhage: relationship with outcome Table 2: Prevalence of cardiac abnormalities on admission.
Cardiac parameters
Total (n=301)
DCI (n=164)
Death (n=58)
Poor outcome (n=66)
ECG
Heart frequency (bpm)
<60 62(21%) 60<>100 212(70%) >100 29(10%)
28(17%) 102(62%)
16(10%) 8(5%) 12(7%) 7(4%) 47(29%) 17(10%) 83(51%) 28(17%) 5(3%) 6(4%) 7(4%)
31/139(22%) 1.1(±0.3) 13/139(9%)
24/139(17%) 26/139(19%)
71/146(49%)
51/117(36%) 78/101(53%) 29/93(20%)
6(10%) 8(12%)
29(67%) 44(67%)
13(22%) 14(21%) 4(7%) 5(8%) 8(14%) 8(12%) 4(7%) 4(6%) 18(31%) 22(33%)
10(17%) 10(15%) 3 33(57%) 38(58%)
11(19%) 12(18%)
3(5%) 3(5%) 4(7%) 4(6%) 3(5%) 4(6%)
16/52(28%) 19/60(29%) 1.2(±0.4) 1.2(±0.4) 6/52(10%) 8/60(12%)
16/52(28%) 18/60(27%) 10/50(17%) 11/57(17%)
33(57%) 37(56%)
27/48(47%) 28/55(42%) 31/39(53%) 37/45(56%) 13/40(22%) 14/46(21%)
Pathological Q-wave present ST depression
ST elevation
Negative T-waves
ST segment “Ischemic” QTc prolongation LVH – Sokolow – Lyon Strain pattern
Low voltage
Myocardial infarction pattern Echocardiography (N=279) WMSI >1.0
Mean WMSI (±SD)
WMAs of Basal segments
WMAs of Midventricular segments
WMAs of Apical segments Diastolic dysfunction Laboratory findings Elevated Troponin T (μg/L)*
Elevated NT-proBNP (ng/L)* Decreased GFR (ml/min)*
14(5%) 26(9%) 10(3%)
79(26%)
33(11%) 145(48%) 56(19%) 14(5%) 8(3%) 13(4%)
59(20%) 1.1(±0.2) 28(9%)
46(15%) 39(13%)
143(47%)
97/261(37%) 159/225(71%) 66/217(30%)
N: number of patients; LVH: Left ventricular hypertrophy. WMSI: wall motion score index, WMAs: wall motion abnormalities; GFR: glomerular filtration rate; SD: Standard Deviation. *The upper and lower limits of normal as defined by the local laboratory were used as reference. In case of missing data the number of patients with available data is given after the forward slash.
Main results:
Table 3 shows the adjusted RRs for the association of WMSI ≥ 1.2 and the three outcomes. A WMSI ≥ 1.2 is associated with death and poor outcome independent of known predictors for these outcomes. As NT-proBNP was the only variable that changed the RRs > 5%, the RRs for WMSI ≥ 1.2 and outcome, adjusted for elevated NT-proBNP is also given in table 3.
45
