
Page 48 - Cardiac abnormalities after aneurysmal subarachnoid hemorrhage
P. 48
Chapter 3
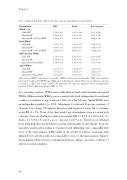
Table 3: Adjusted Risk Ratios (RR) for the three outcomes and wall motion abnormalities.
Determinants
DCI
Death
Poor outcome
WMSI > 1.1
Crude RR
Adjusted RR*
Adjusted RR for NT-proBNP
Basal WMAs
Crude RR
Adjusted RR*
Adjusted RR for NT-proBNP
Midventricular WMAs
Crude RR
Adjusted RR*
Adjusted for NT-proBNP
Apical WMAs
Crude RR
Adjusted RR*
Adjusted for NT-proBNP
1.2(0.9-1.6) 1.2(0.9-1.5) 1.2(0.9-1.7)
1.0(0.7-1.4) 0.9(0.7-1.4) 1.0(0.6-1.5)
1.1(0.9-1.4) 1.1(0.8-1.4) 1.1(0.8-1.5)
1.4(1.1-1.7) 1.3(1.1-1.7) 1.4(1.0-1.8)
1.9(1.1-3.4) 1.9(1.1-3.3) 1.6(0.8-3.3)
1.2(0.6-2.5) 1.2(0.6-2.5) 0.8(0.3-2.5)
2.3(1.4-3.7) 2.3(1.4-3.8) 1.8(0.9-3.5)
1.5(0.8-2.8) 1.5(0.8-2.7) 1.4(0.6-3.2)
1.8(1.1-3.0) 1.8(1.1-3.0) 1.6(0.8-3.0)
1.4(0.7-2.6) 1.4(0.7-2.6) 1.3(0.6-2.8)
2.2(1.4-3.4) 2.2(1.4-3.5) 1.9(1.0-3.4)
1.4(0.7-2.6) 1.4(0.8-2.5) 1.5(0.8-2.8)
Abbreviations; WMSI: wall motion score index. WMAs: wall motion abnormalities, LVH: left ventricular hypertrophy; *adjusted for WFNS, age, Hijdra score. Adjustment for elevated Troponin on admission, presence of Q-waves on ECG, low voltage on ECG, ST depression, ST elevation, Negative T-waves, prolonged QT interval (>500ms) yielded in a change of RR of < 5%.
As a secondary analysis, WMAs were subdivided in basal, midventricular and apical WMAs. Midventricular WMAs were associated with death, independent from clinical condition on admission, age or amount of blood on the CT-scan. Apical WMAs were an independent predictor for DCI. Adjustment for elevated Troponin, presence of Q-waves, low voltage, ST-segment deviation, and negative T-waves led to a change in the RR of < 5%. None of the other cardiologic determinants were associated with outcome. Diastolic dysfunction had a univariable RR for DCI of 1.0(0.8-1.2), for death of 1.5(0.9-2.3) and for poor outcome 1.4(0.9-2.2). Therefore we refrained from including diastolic dysfunction in the multivariable model. Results from the sensitivity analysis after exclusion of patients with rebleeding were comparable with those of the main analysis. Additionally, in the sensitivity analysis on patients with definite DCI only, the results are comparable to those of the main analysis. Figure 1 shows Kaplan-Meier curves for cumulative death according to presence or absence of wall motion abnormalities.
46
