
Page 44 - Zero for nine: Reducing alcohol use during pregnancy via health counselling and Internet-based computer-tailored feedback
P. 44
Chapter 2
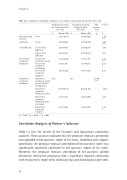
Table 2.2 (continued). Univariate analyses of correlates of prenatal alcohol use (N = 158)
Pregnant women not using alcohol (N = 44)
Pregnant women using alcohol (N = 114)
Chi- square- test
T-test
%
Mean (SD)
%
Mean (SD)
χ2
T
Motivational factors:
Attitude Self efficacy
Perceived partner’s influence
Reported partner’s influence
Pros Cons
Social Self Efficacy
Stress Self Efficacy
Perceived partner’s norm Perceived partner’s modeling Perceived partner’s support
Reported 82.5 partner’s norm
(no alcohol in pregnancy)
Reported partner’s drinks per day
Reported partner’s drinking days per week
Reported partner’s support
4.26 (0.58)
1.46 (0.51)
1.79 (0.84)
1.44 (0.74)
4.42 (0.96) 2.15 (1.16)
3.94 (1.20)
54.5
0.78 (0.64) 2.21 (1.95)
4.26 (1.03)
3.69 (0.95)
1.68 (0.69)
2.01 (0.98)
1.26 (0.42)
3.36 (1.37) 1.73 (0.97)
3.86 (1.03)
0.92 (0.82) 2.98 (2.06)
3.82 (1.04)
13.08 ***
3.70 ***
-1.92 ***
-1.44 1.83
4.71 *** 2.14 *
0.37
-1.09
-2.17 *
2.43 *
*p < 0.05; **p < 0.01; ***p < .001.
Correlation Analyses of Partner’s Influence
Table 2.3 lists the results of the Pearson’s and Spearman’s correlation analyses. These analyses indicated that the pregnant woman’s perception corresponded to her partner’s report of his norm, modelling and support. Specifically, the pregnant woman’s perception of her partner’s norm was significantly positively correlated to her partner’s report of his norm. Moreover, the pregnant woman’s perception of her partner’s alcohol abstinence during her pregnancy had a significant negative correlation with the partner’s report of his drinks per day and drinking days per week.
42
