
Page 43 - Zero for nine: Reducing alcohol use during pregnancy via health counselling and Internet-based computer-tailored feedback
P. 43
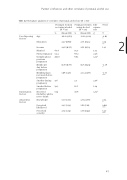
Partner’s influences and other correlates of prenatal alcohol use
Table 2.2 Univariate analyses of correlates of prenatal alcohol use (N = 158)
Pregnant women not using alcohol (N = 44)
Pregnant women using alcohol (N = 114)
Chi- square- test
T-test
%
Mean (SD)
%
Mean (SD)
χ2
T
Pre-disposing Age factors
Education
Income
Married
First pregnancy
Complications previous pregnancy
Drinks per day before pregnancy
Drinking days per week before pregnancy
Smokes during pregnancy
Smoked before pregnancy
Information Received
factors midwife’s advice
not to drink
Awareness Knowledge factors
Perceived likelihood
Perceived severity
30.21 (4.63) 2.47 (0.60) 2.46 (0.56)
0.36 (0.76) 1.06 (1.48)
5.38 (1.55) 2.45 (1.34) 2.79 (1.19)
31.84 (4.22) 2.75 (0.44) 2.61 (0.54)
0.75 (0.99) 2.34 (2.06)
4.64 (1.86) 1.61 (1.10) 1.77 (0.99)
-2.03 3.19
65.8 54.4 20.18
9.6 19.3 57.9
54.5 68.2 6.82
2.3 11.6 38.6
1.72 2.48 4.12*
2.46 1.29 4.72*
1.41
-2.36 *
-3.77 ***
2.54 *
4.00 ***
5.47 ***
* 2 **
41
