
Page 50 - PIECES OF THE PUZZLE Eline Vissia
P. 50
CHAPTER 3
112
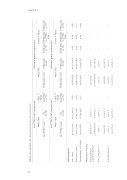
Table 3.1 Demographic and clinical characteristics of the participants All-PTSD to HC comparison
Different group comparisons
Demographics
Age, years
Education, years Handedness, n (%right)
42.33 (10.91) 14.91 (0.91) 29 (90.63%)
41.75 (12.29) 15.04 (1.20) 27 (96.43%)
0.85 0.64 0.37
43.82 (9.85) 14.88 (0.99) 14 (87.50%)
40.75 (12.05) 14.94 (0.85) 15 (93.75%)
0.56 0.64 0.54
0.45 0.88 0.99
0.78 0.77 0.99
Medication history
Antipsychotics: n(typical,atypical)
past:2(1,1) current:8(2,6)1 past:1
past: 0 current: 0 past: 0
- -
past:2(1,1) current:8(2,6)1 past:1
past: 0 current: 0 past: 0
- -
- -
- -
Anti-epileptics: n
Antidepressant: n
current:3 past: 2 current:12
current: 0 past: 0 current: 0
-
current:3 past: 2 current:10
current: 0 past: 0 current: 2
-
-
-
Mean (SD)
t-test: P Value
Mean (SD)
t-test: P Value PTSD-DID PTSD-DID PTSD-only
All-PTSD (n=33) HC (n=28)
All-PTSD vs. HC
PTSD-DID (n=17)
PTSD-only (n=16)
vs. HC vs. PTSD- vs. HC only
All-PTSD to HC comparison
Different group comparisons
Mean (SD) All-PTSD (n=33)
t-test: P Value
Mean (SD)
t-test: P Value PTSD-DID PTSD-DID PTSD-only
HC (n=28)
All-PTSD vs. HC
PTSD-DID (n=17)
PTSD-only (n=16)
vs. HC
vs. PTSD- only
vs. HC
