
Page 52 - Sample Moderate prematurity, socioeconomic status,
and neurodevelopment in early childhood
P. 52
Chapter 4
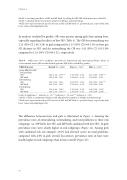
Model 2: assessing joint effects of SES and MP birth, by adding the SES*MP birth interaction to Model 1. Model 3: adjusting Model 1 for gender, number of siblings, and maternal age.
a Odds ratios represent the risk per SD decrease in SES and MP birth (i.e. gestational age), respectively, with lower values indicating higher risk.
In analyses stratified by gender, ORs were greater among girls than among boys, especially regarding the effects of low SES (Table 4). The OR for externalizing was 2.23 (95% CI 1.46-3.38) in girls compared to 1.15 (95% CI 0.88-1.50) in boys per SD decrease in SES, and for internalizing the OR was 1.43 (95% CI 1.03-1.98) compared to 1.16 (95% CI 0.89-1.52), respectively.
Table 4 Odds ratios (95% confidence intervals) for behavioural and emotional problems: effects of socioeconomic status (SES) and moderately preterm (MP) birth, stratified by gender
CBCL Outcome
Overall (N = 1458)
Boys (n = 790)a
Girls (n = 668)a
Score, OR (95% CI)b Total problems
SES
MP birth Externalizing
SES
MP birth Internalizing
SES
MP birth
1.42 (1.14 - 1.77)*** 1.24 (1.00 - 1.56)
1.21 (0.99 - 1.50) 1.31 (1.05 - 1.63)*
1.26 (1.03 - 1.54)* 1.41 (1.13 - 1.73)***
1.15 (0.88 - 1.50) 1.24 (0.93 - 1.64)
0.99 (0.77 - 1.26) 1.24 (0.95 - 1.61)
1.16 (0.89 - 1.52) 1.34 (1.00 - 1.79)
2.23 (1.46 - 3.38)*** 1.24 (0.86 - 1.78)
2.09 (1.36 - 3.21)*** 1.50 (1.00 - 2.26)
1.43 (1.03 - 1.98)* 1.48 (1.08 - 2.04)*
Levels of significance: * indicates p < .05, ** indicates p < .01,
a Model 3 (Table 2): multivariate analysis with adjustment for number of siblings and maternal age.
b Odds ratios represent the risk per SD decrease in SES and MP birth (i.e. gestational age), respectively, with lower values indicating higher risk.
The difference between boys and girls is illustrated in Figure 1, showing the prevalence rates of externalizing, internalizing, and total problems in three risk subgroups (i.e. MP birth, low SES, and MP birth combined with low SES). In girls prevalence rates were clearly higher in risk subgroups (Figure 1a). Among girls with combined risk, for example, 13.0% had elevated scores on total problems, compared with 4.9% in girls overall. In contrast, prevalence rates in boys were hardly higher in risk subgroups than in boys overall (Figure 1b).
68
and *** indicates p < .005
