
Page 84 - The diagnostic work-up of women with postmenopausal bleeding
P. 84
Chapter 4
82
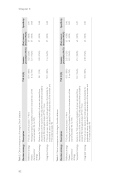
Table 2. Clinical consequences of strategies, Dutch database
Decision strategy
Description
TVS N (%)
Invasive procedures N (%)
(Pre) cancers detected N (%)
Specificity
Reference strategy
TVS only (current practice) > 4mm
559 (100%) 0 (no TVS)
352 (63.0%) 521 (93.2%)
57 (100%) 0.41 57 (100%) 0.08
‘Patient characteristics’ strategy
Histological analysis if probability based on characteristics of the women exceeds 4% (no TVS)
‘Sequential’ strategy ‘Integrated’ strategy
Decision for TVS based on probability of cancer calculated from characteristics of the women,TVS only performed when probability exceeds 4%, histological analysis if TVS > 4mm
521 (93%) 559 (100%)
320 (57.2%) 316 (56.5%)
57 (100%) 0.48 57 (100%) 0.48
TVS in all women, decision for histological analysis if probability for endometrial cancer calculated from characteristics of the women and TVS model exceeds 4%
Table 3. Clinical consequences of strategies, Swedish database
Decision strategy
Description
TVS N (%)
Invasive procedures N (%)
(Pre) cancers detected N (%)
Specificity
Reference strategy
TVS only (current practice) > 4mm
433 (100%) 0 (no TVS)
265 (61.2%) 401 (92.6%)
65 (100%) 0.46 65 (100%) 0.09
‘Patient characteristics’ strategy
Histological analysis if probability based on characteristics of the women exceeds 4% (no TVS)
‘Sequential’ strategy ‘integrated’ strategy
Decision for TVS based on probability of cancer calculated from characteristics of the women,TVS only performed when probability exceeds 4%, histological analysis if TVS > 4mm
401 (92.6%) 433 (100%)
251 (58.0%) 248 (57.2%)
65 (100%) 0.49 65 (100%) 0.50
TVS in all women, decision for histological analysis if probability for endometrial cancer calculated from characteristics of the women and TVS model exceeds 4%
