
Page 74 - Cardiac abnormalities after aneurysmal subarachnoid hemorrhage
P. 74
Chapter 5
CT imaging
CT imaging was performed on 16- or 64-multidetector CT scanners (Philips Healthcare). For CTP, 40 mL of non-ionic contrast agent (lopromide, Ultravist, 300 mg iodine/mL, Schering) followed by 40 mL saline was injected intravenously at a rate of 5 mL/s. One image per 2 seconds was acquired during 60 seconds, with 512x512 matrix, 160-220 mm field-of-view, and UB filter. Scan parameters were: 16 slice, 90 kVp, 150 mAs, 8x3 mm collimation; 64 slice, 80 kVp, 150 mAs, 64x0.625 mm collimation. Depending on the multidetector type CT scanner, for the CTA scan another 60-80 mL of contrast was injected at a rate of 5 mL/s, followed by a 40 mL saline flush at a rate of 5 mL/s. Imaging was performed with: 90-120 kVp, 150–300 mAs, 512x512 matrix, 200 mm field of view, 0.9–1 mm slice thickness, and 0.45–0.5 mm reconstruction increment.
CTP post-processing
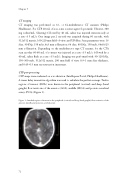
CTP maps were evaluated on a workstation (Intellispace Portal, Philips Healthcare). A tracer delay insensitive algorithm was used to calculate the perfusion maps. Twelve regions of interest (ROIs) were drawn in the peripheral (cortical) and deep (basal ganglia) flow territories of the anterior (ACA), middle (MCA) and posterior cerebral artery (PCA) (Figure 1).
Figure 1: Standard regions of interest in the peripheral (cortical) and deep (basal ganglia) flow territories of the anterior, middle and posterior cerebral artery.
72
