
Page 28 - Cardiac abnormalities after aneurysmal subarachnoid hemorrhage
P. 28
Chapter 2
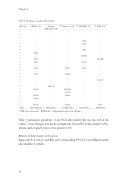
Table 2: Prevalence of cardiac abnormalities.
Reference
WMA n (%)
Diastolic dysfunction n(%)
↑ troponins n (%)
↑ CK-MB n (%)
↑ BNP n(%)
31 32 33 7 34 35 20 36 8 10 11 28 9 27 16 37 12 29 38 13 30 39 40 14 15
Total
----- ----- ----- - - - 7(44) - - - - 7(41) - -----
- - - 4(31) - - - - - 2(15) - - 9(13) - -
7(30) - - - 30(60) -
- 13(100) 15(21) - ----- 5(13) - 8(21) 5(13) - ----- 7(16) - 12(28) - - -----
- - - - 17(45)* -----
- 146(71) - - -
55(22) - - - 48(28) - 79(26) -
126(50) - - 35(51) - - 41(24) - -
- - - - ---
45(19) - 52(22) - 14(9) † 254/1141(22) 146/223(71) 274/811(34) 71/217(33) 44/286(15)
*: BNP ratios were used. †: BNP levels > 600pg/ml was used as cut-off value.
Table 3 summarizes prevalence of any ECG abnormality that was reported in the studies. T wave changes were the most frequently observed ECG abnormality (22%), whereas pathological Q waves were present in 1%.
Relation of determinants with outcome
Figure 2A shows the pooled RRs and corresponding 95% CI of the defined cardiac abnormalities for death.
26
