
Page 77 - scheppingen
P. 77
CODING AND SMALL NON-CODING TRANSCRIPTIONAL LANDSCAPE OF TSC
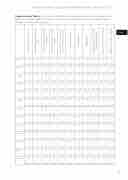
Supplementary Table 3 Correlation of miRNAs with modules enriched for specific gene ontol- ogy terms. The top value in each cell is the Pearson’s correlation coefficient, the lower value in brackets is the associated p-value.
MIR100
0.54 (0.010)
0.34 (0.120)
0.31 (0.162)
0.65 (0.001)
-0.19 (0.388)
-0.13 (0.552)
-0.38 (0.078)
-0.24 (0.291)
-0.30 (0.176)
-0.52 (0.013)
-0.47 (0.029)
MIR1262
0.57 (0.006)
-0.06 (0.807)
0.42 (0.053)
0.65 (0.001)
-0.25 (0.268)
-0.11 (0.641)
-0.23 (0.301)
-0.03 (0.894)
-0.24 (0.287)
-0.56 (0.006)
-0.40 (0.064)
MIR141
0.65 (0.001)
0.11 (0.623)
0.48 (0.025)
0.66 (0.001)
-0.28 (0.200)
-0.12 (0.585)
-0.43 (0.047)
-0.16 (0.475)
-0.25 (0.256)
-0.58 (0.005)
-0.51 (0.014)
MIR142
0.77 (0.000)
0.18 (0.419)
0.57 (0.006)
0.63 (0.002)
-0.22 (0.327)
0.05 (0.827)
-0.42 (0.050)
-0.22 (0.319)
-0.28 (0.204)
-0.57 (0.006)
-0.41 (0.057)
MIR151B
0.37 (0.094)
0.66 (0.001)
0.39 (0.074)
0.45 (0.037)
0.06 (0.776)
0.00 (0.989)
-0.43 (0.049)
-0.40 (0.062)
-0.32 (0.145)
-0.32 (0.153)
-0.37 (0.088)
MIR152
0.66 (0.001)
0.17 (0.462)
0.60 (0.003)
0.81 (0.000)
-0.10 (0.671)
-0.21 (0.356)
-0.47 (0.029)
-0.29 (0.194)
-0.50 (0.019)
-0.68 (0.000)
-0.63 (0.002)
MIR182
0.60 (0.003)
0.00 (0.989)
0.34 (0.122)
0.37 (0.089)
-0.21 (0.354)
0.15 (0.495)
-0.15 (0.504)
0.02 (0.935)
-0.05 (0.830)
-0.32 (0.146)
-0.12 (0.585)
MIR193A
0.69 (0.000)
0.13 (0.563)
0.52 (0.012)
0.83 (0.000)
-0.19 (0.403)
-0.19 (0.393)
-0.49 (0.022)
-0.25 (0.258)
-0.45 (0.036)
-0.73 (0.000)
-0.65 (0.001)
MIR193B
0.56 (0.007)
0.29 (0.186)
0.50 (0.017)
0.66 (0.001)
-0.12 (0.606)
-0.30 (0.168)
-0.48 (0.025)
-0.36 (0.095)
-0.46 (0.032)
-0.62 (0.002)
-0.59 (0.004)
MIR200A
0.58 (0.005)
0.48 (0.022)
0.55 (0.008)
0.66 (0.001)
0.00 (0.983)
-0.06 (0.790)
-0.54 (0.010)
-0.43 (0.047)
-0.45 (0.035)
-0.56 (0.007)
-0.55 (0.008)
MIR200B
0.74 (0.000)
0.24 (0.292)
0.51 (0.015)
0.72 (0.000)
-0.19 (0.405)
-0.08 (0.737)
-0.42 (0.053)
-0.16 (0.481)
-0.30 (0.176)
-0.62 (0.002)
-0.51 (0.016)
MIR200C
0.47 (0.026)
0.16 (0.490)
0.43 (0.045)
0.58 (0.005)
-0.13 (0.572)
-0.14 (0.525)
-0.44 (0.039)
-0.28 (0.210)
-0.33 (0.129)
-0.46 (0.030)
-0.48 (0.024)
MIR208B
0.46 (0.032)
0.05 (0.841)
0.19 (0.386)
0.59 (0.004)
-0.20 (0.372)
-0.21 (0.351)
-0.20 (0.368)
-0.15 (0.509)
-0.32 (0.141)
-0.53 (0.012)
-0.40 (0.063)
75
three
Innate immune response
Oligodendrocyte differenti- ation
Type I interferon signaling pathway
Extracellular matrix organi- sation
Nucleobase-contating com- pound metablic process
Synaptic signaling Neurogenesis Angiogenesis
Negative regulation of den- drite development
Nervous system development Glutamate receptor signaling
