
Page 176 - scheppingen
P. 176
seven
174
Classification of TSC cortical tubers: from histology to epigenetics
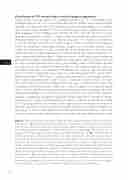
Several studies have focused on the histological patterns of TSC 1-3. Knowledge about histological features of TSC is crucial to discover distinct profiles, which help to improve diagnosis and decrease inter-rater variability between neuropathologists, and predic- tions of post-surgical outcome. The International League Against Epilepsy (ILAE) task- force proposed a new histological classification for FCD 4, the most common cause of drug-resistant epilepsy in children 5. Several studies have reported important clinical dif- ferences between the subtypes using these classifications 6, 7. In Chapter 2, we presented a new classification system for TSC tubers; type A, B and C, based on the histological pattern of calcifications, dysmorphic neurons and giant cells. Until now, no other clinical studies have compared this tuber classification to clinical outcome, most likely since the classification has been proposed recently. However, we were able to match our TSC tuber sequencing data described in Chapter 3, to our classification system, comparing gene expression patterns between the different tuber types. In our final sequencing anal- ysis, after all quality controls (see Chapter 3) we included 5 tubers that could be classified as a tuber type A, and 7 tubers that were classified as tuber type B. Since only 1 tuber was classified as tuber type C, we could not make comparisons using this type. We found 246 genes that were upregulated, and 33 genes that were downregulated in type B tubers compared to type A tubers (Fig 1A). Interestingly, most notably, inflammatory pathways seem highly overrepresented in type B tubers, in contrast to type A tubers. This con- firms the changes we see on histological level, since a gain in inflammatory markers and microglial activation was found in type B and C tubers, and gliosis was increased in type B tubers, whereas no differences could be detected for type A tubers. Amongst the upreg- ulated gene ontology terms (GO terms) were the immune and inflammatory response, adhesion, angiogenesis and positive regulation of gene expression. The specific upregu- lated pathways in type B compared to type A tubers include the tumor necrosis factor (TNF) signaling pathway, the nuclear factor kappa-light-chain-enhancer of activated B cells (NF-κB) pathway, cytokine-cytokine receptor interaction and Toll-like receptor sig- naling (Fig 1 C and D). Taken together, activation of inflammatory pathways seems one of the main discriminators between type A and B tubers on gene expression level. Since
Figure 1. Differentially expressed mRNAs in type B tubers compared to type A tubers as identified from RNA-Seq. A Volcano plot of differentially expressed mRNAs as identified from mRNA-Seq. Volcano plot showing the differential expressed genes (DEGs) between the type A and type B tu- bers. 246 genes were up-regulated in type B tubers (adjusted p-value<0.05, fold-change>1.3), and 33 genes were down-regulated (adjusted p-value<0.05, fold-change<-1.3). B Enrichment map of enriched pathways derived from the differentially expressed gene lists. 20 pathways were consid- ered enriched (Benjamini-Hochberg corrected p-value<0.05). Each node represents a pathway; the size of the node reflects the statistical significance of each pathway. The larger the node, the smaller the adjusted p-value e.g. MAPK signaling pathway was statistically more significant than the complement and coagulation cascades pathway. The edge connection between nodes rep- resents the similarity between the genes list of each pathway, the thicker the edge the more simi- lar the gene lists. C Enriched gene ontology (GO) terms derived from the differentially expressed gene lists. 21 biological processes GO terms were identified as enriched (Benjamini-Hochberg corrected p-value<0.05). Each enriched GO term is listed on the y-axis, the x-axis is the log10(1/ adjusted p-value), n is equal to the number of the DEGs in each gene ontology term.
